All rights reserved
8750 x 3508
Download
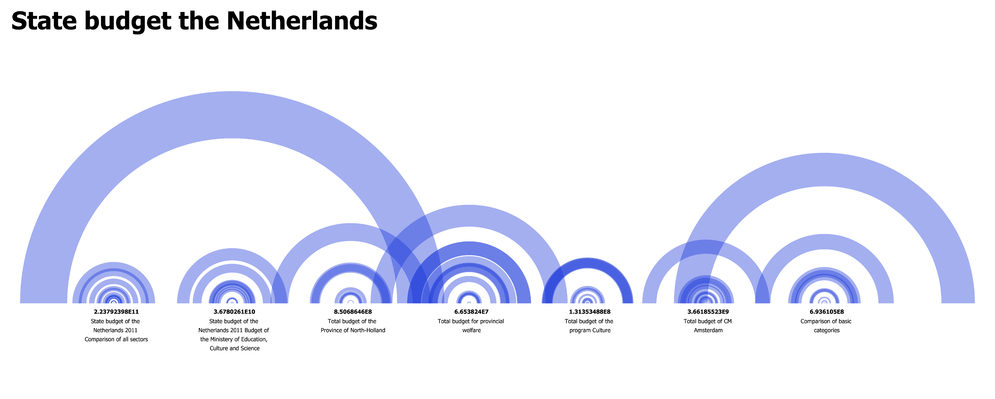
Data visualisation sketch 2 of the state budget shows the amount of money that is going to each of the projects by transperancy and size. The color was chosen because of the transparency in the overlay of the arcs. You can clearly see that some projects get a lot more than others.
The graphic was programmed with Processing.