All rights reserved
11667 x 2300
Download
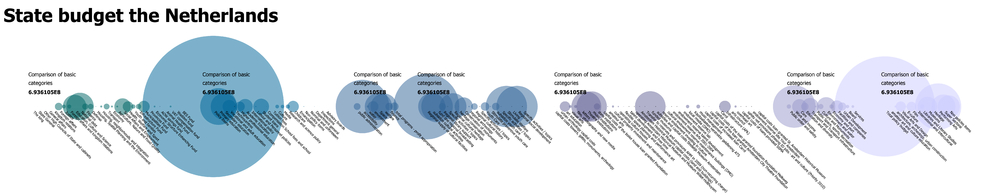
ata visualisation sketch version 3.3 of the state budget.
This visualisaton shows the amount of money that is going to each of the projects by transperancy and size. The different colors I used to try and make it even more clear. The graphic is clear and easy to read. And that what I was going for with this graphic.
The text below is to make it even more clear where the graphics starts and stops.
The graphic was programmed with Processing.