All rights reserved
9896 x 4019
Download
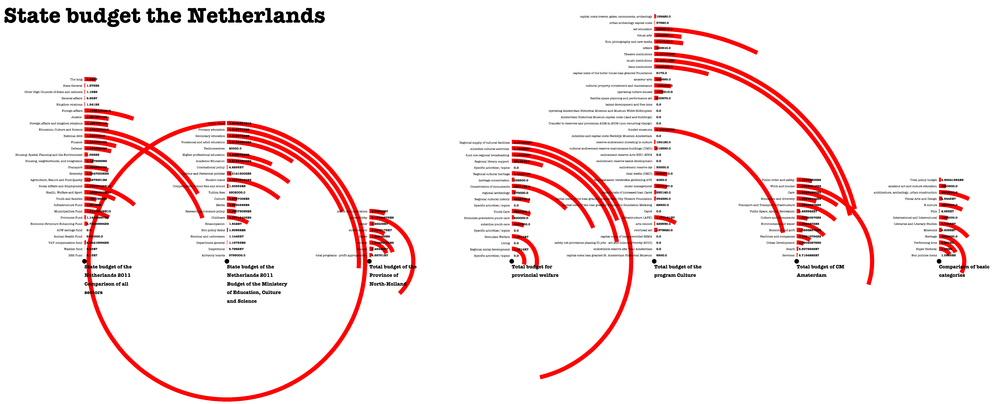
Data visualisation sketch version 1.5 of the state budget.
The arcs represent the amount of money thats going to each project. The design is based on old versions of infographics.
The color is red because I want it to get a lot of attention.
Also the thing I was going for it to stand out.
The graphic was programmed with Processing.