All rights reserved
2800 x 542
Download
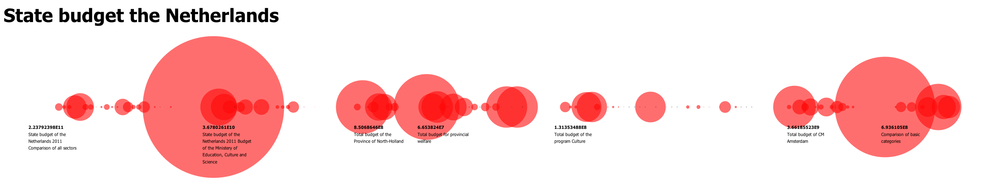
Data visualisation sketch version 3 of the state budget.
This visualisaton shows the amount of money that is going to each of the projects by transperancy and size. The color is again chosen for its effect. The graphic is clear and easy to read. And that what I was going for with this graphic. This one is with out the text. Because this was one of the before sketches.
The graphic was programmed with Processing.