All rights reserved
3333 x 5000
Download
infographic4 square grid
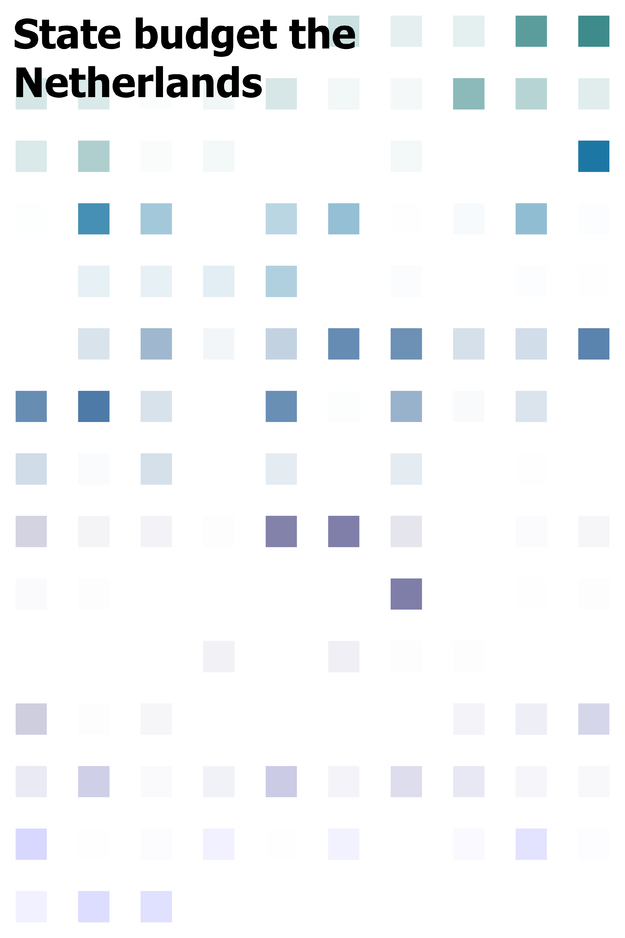
Data visualisation sketch version 4 of the state budget.
This visualisaton shows the amount of money that is going to each of the projects by transperancy. The colors represent all the different tabels that are used. And the graphic gifs a clear view of what is happening. I stored the data in a grid to make is easy to read and see the whole picture at once. This one is with out the text because its a sketch of the other one with the text. And I wanted to see what would happen if there where only squares.
The graphic was programmed with Processing.