All rights reserved
3875 x 5500
Download
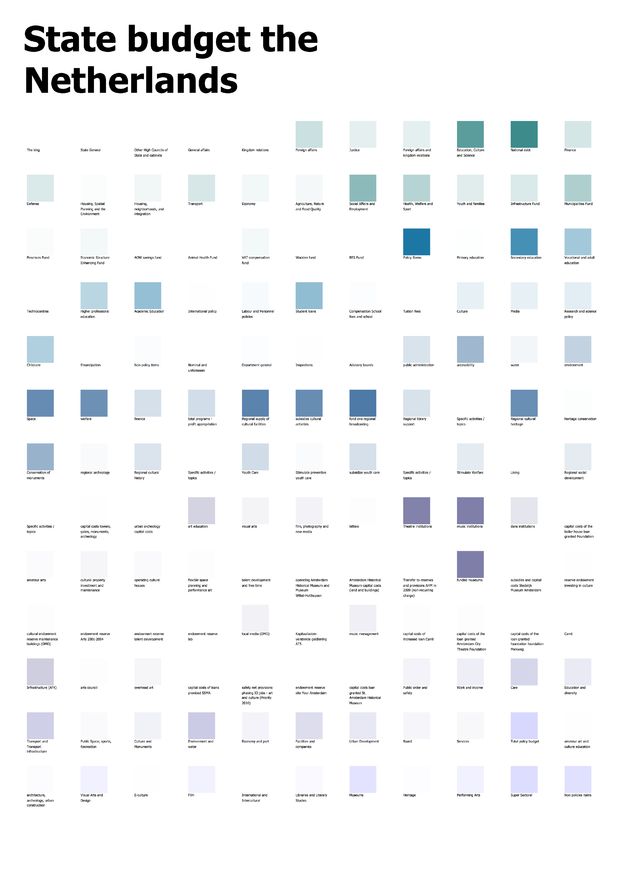
Disappearing Cultural Blocks
Data visualisation sketch version 4.3 of the state budget.
This visualisaton shows the amount of money that is going to each of the projects by transperancy. The colors represent all the different tables that are used. And the graphic gives a clear view of what is happening. I stored the data in a grid to make is easy to read and see the whole picture at once. This one is with text because I wanted to show what project is getting what amount.
The graphic was programmed with Processing.