Why?
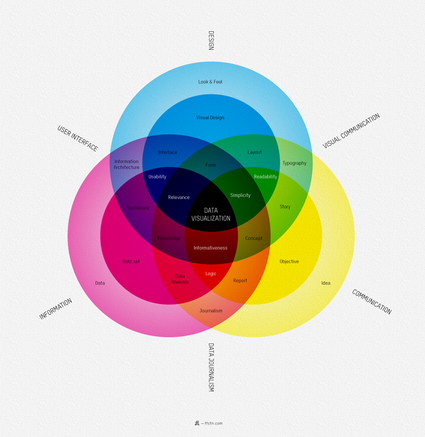
The last few years have seen unprecedented amounts of open data published in the Web, as well as renewed growth in the presentation technologies offered by modern web browsers. Despite this, data visualization, exploration and navigation techniques are still relatively inaccessible; to end users as well as to many technologists. It can be hard to keep up with the latest technical possibilities, or to find the right combination of skills, tools and data needed for some project or application.
What?
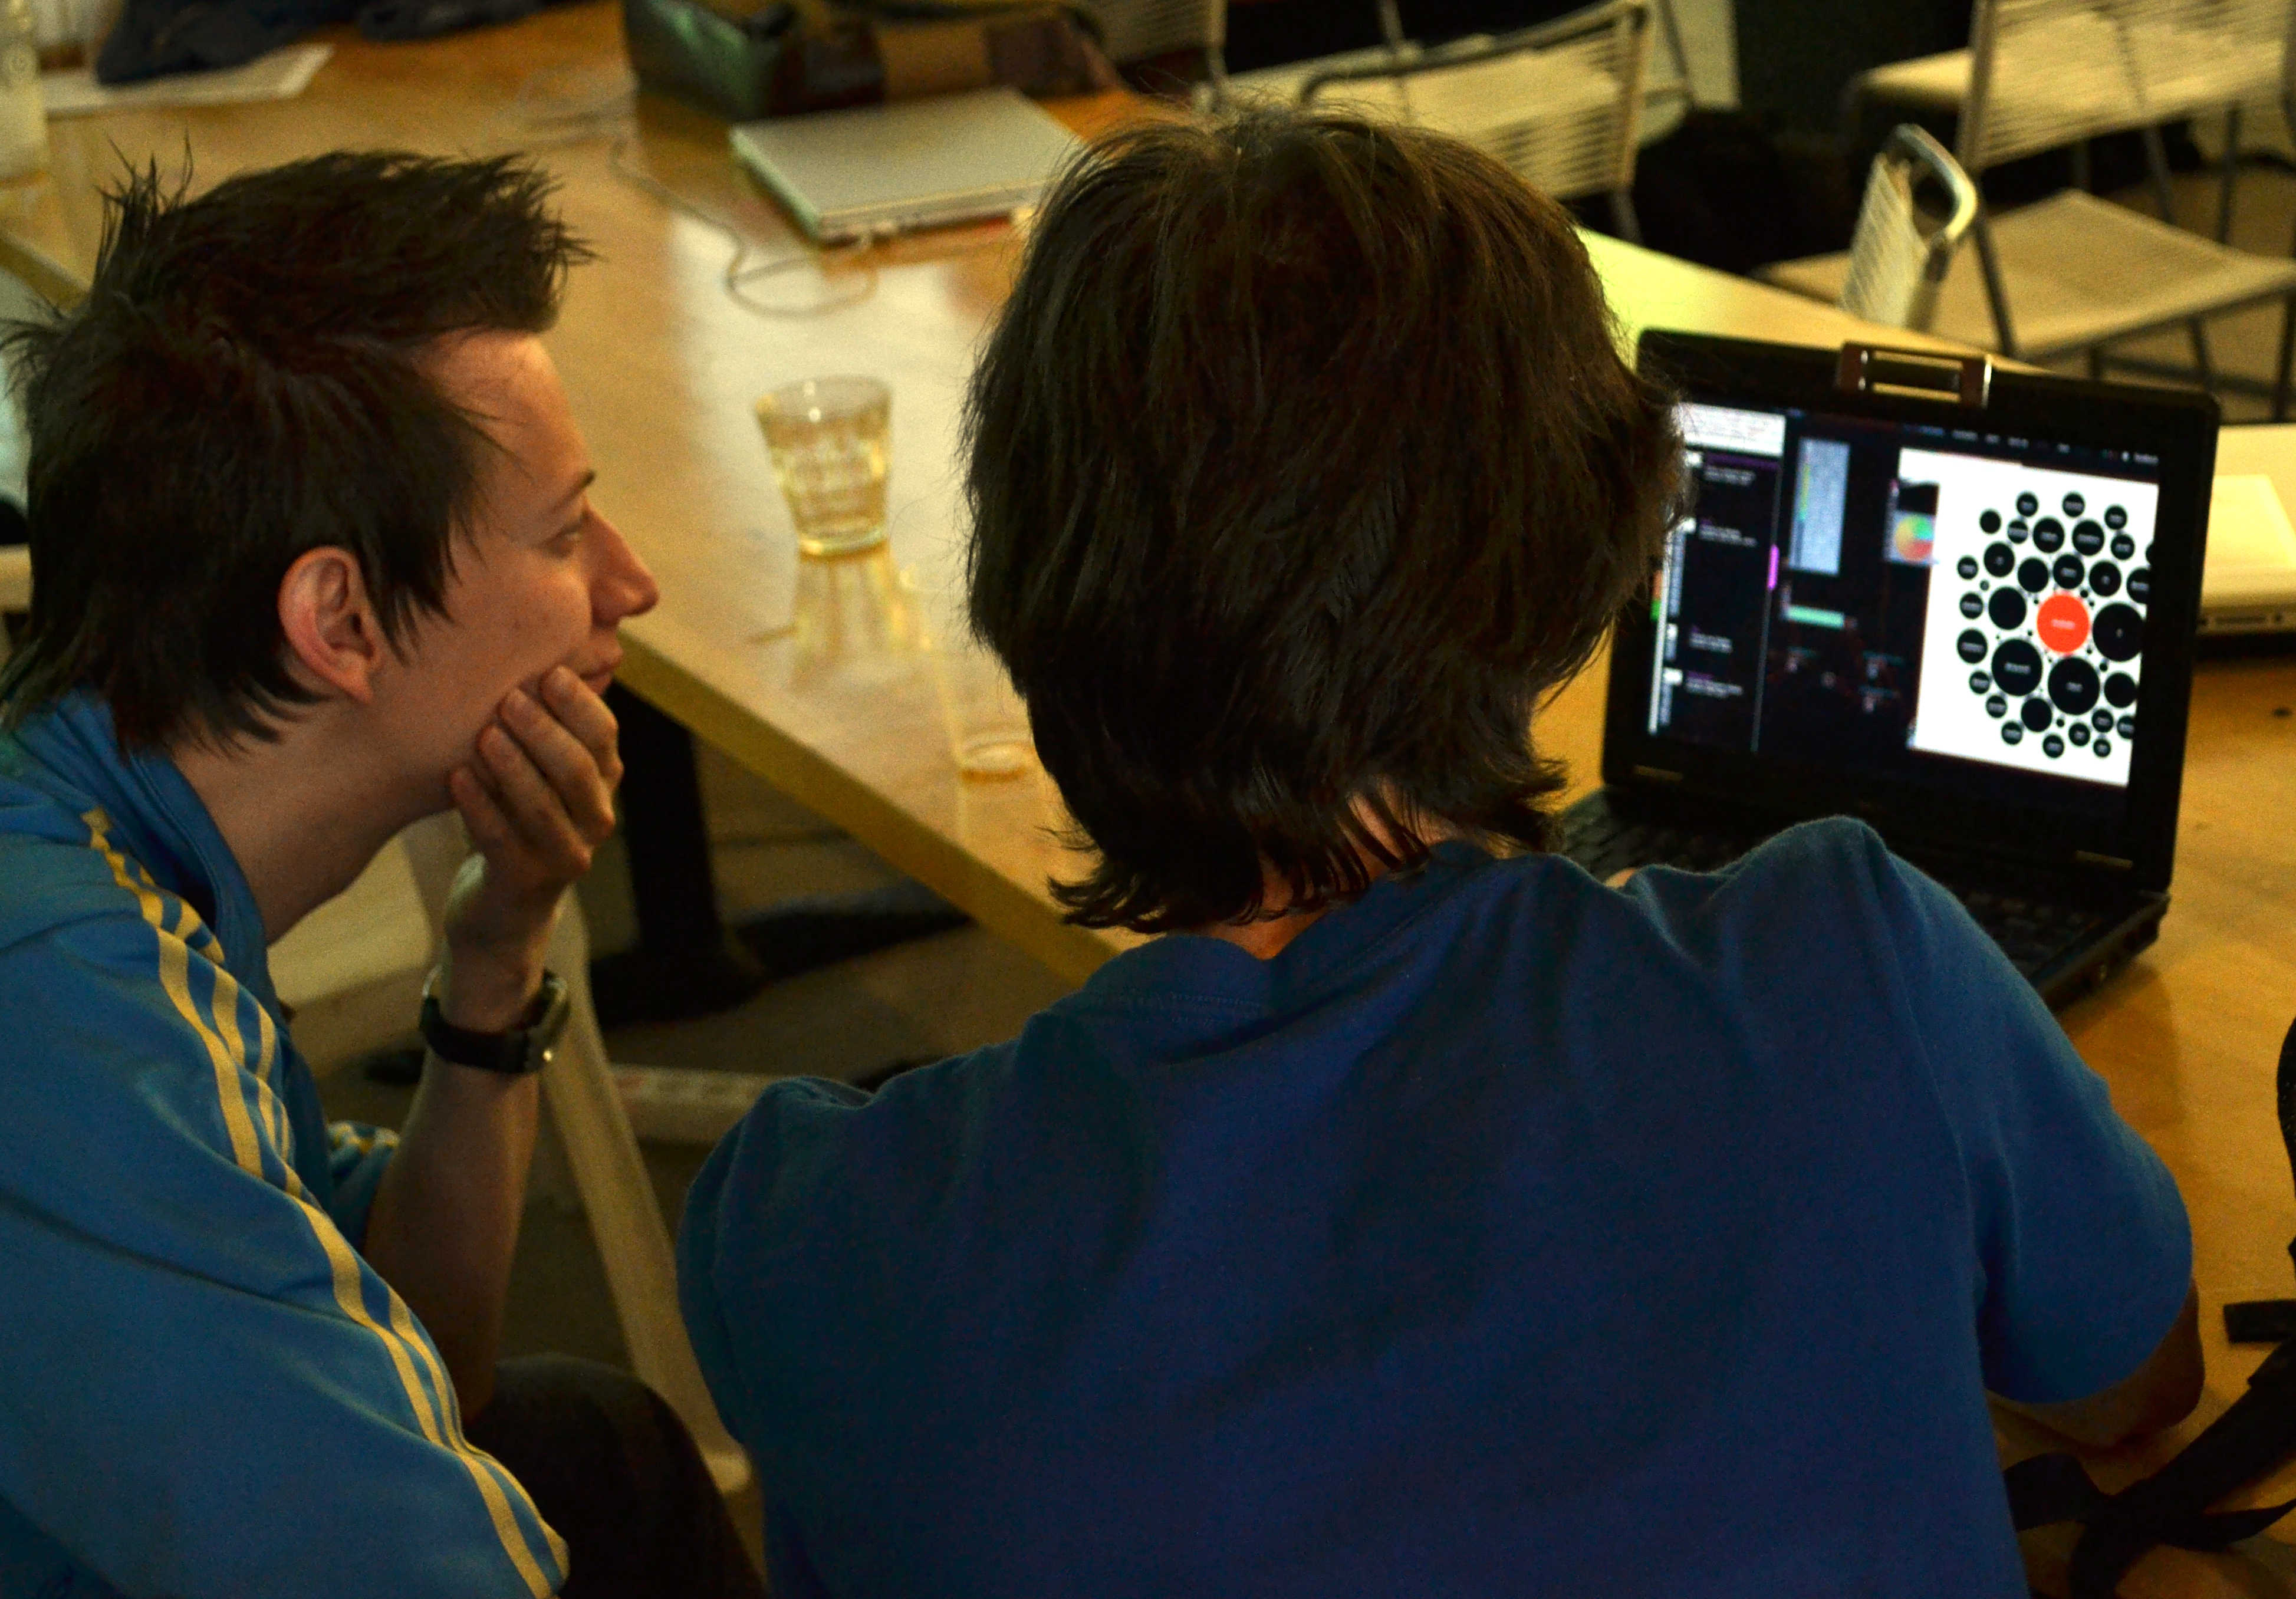
This BarCamp is devoted to interdisciplinary collaboration, skill sharing and prototyping around building better interfaces to ‘the Web of data’. While it is a technical workshop, we expect participants with a variety of backgrounds: whether visual and interface design, data mining, statistics, business intelligence, or front-end Web development, most of us working in this area have gaps in our knowledge.
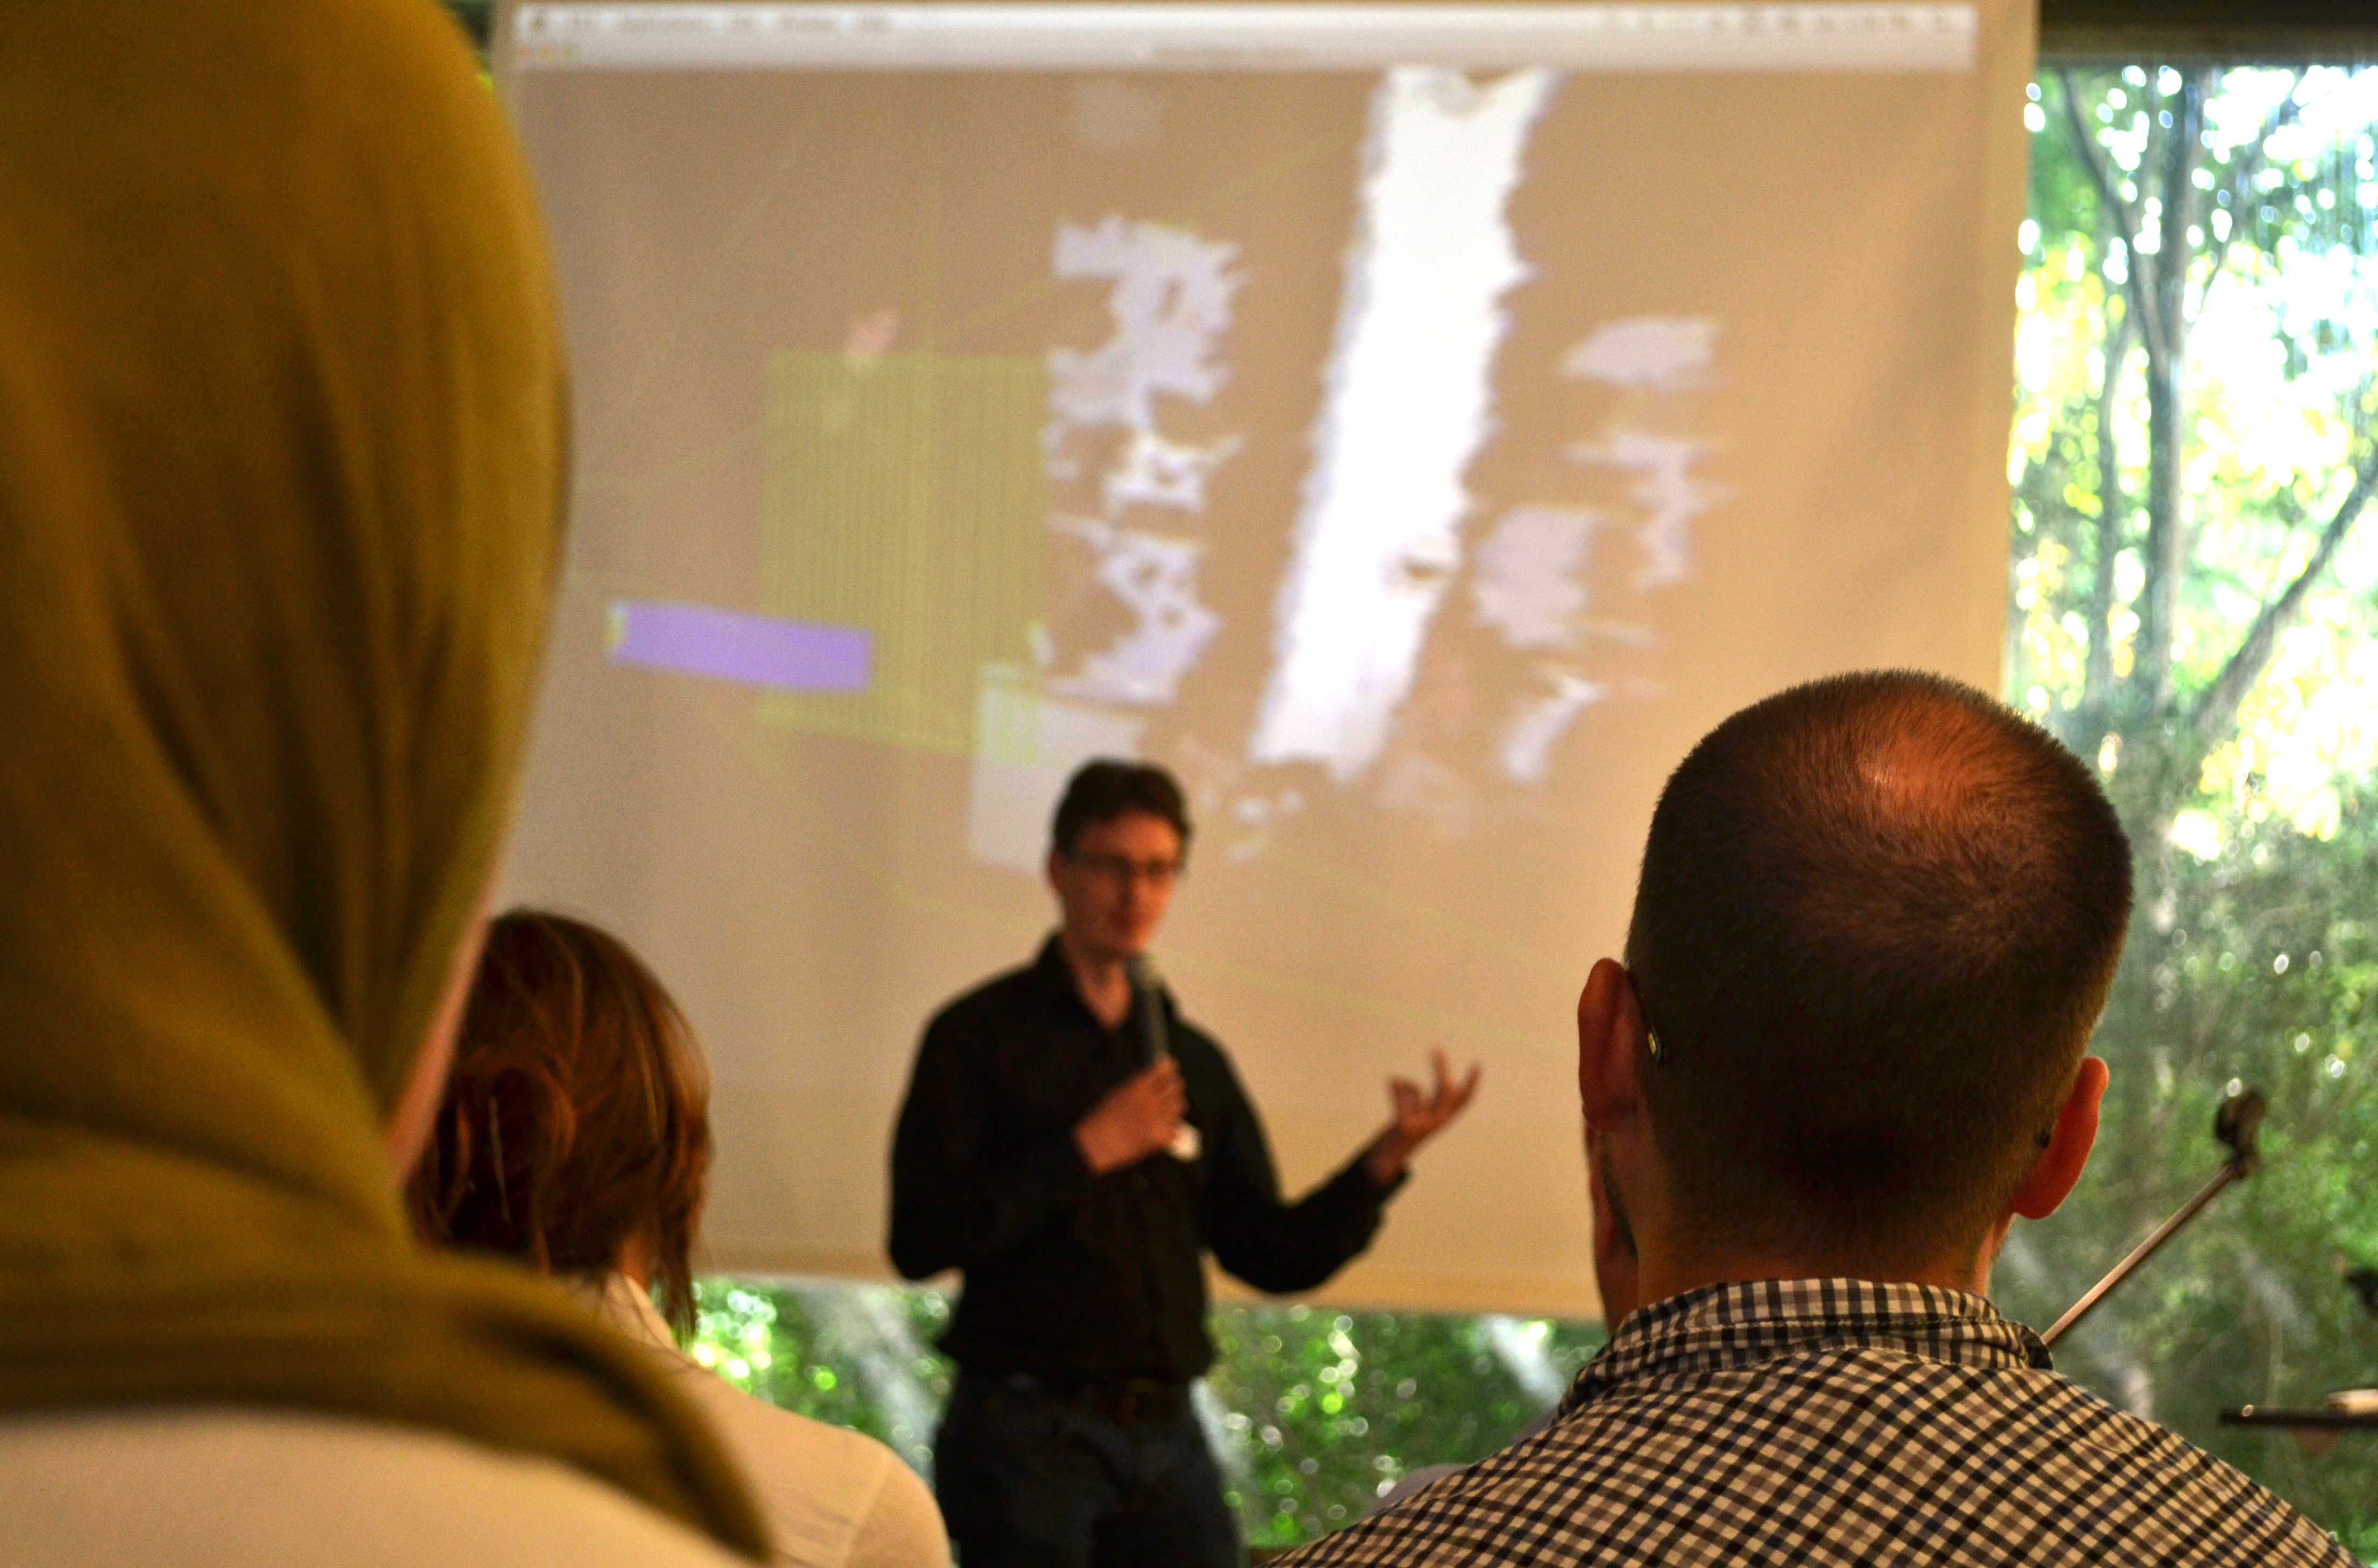
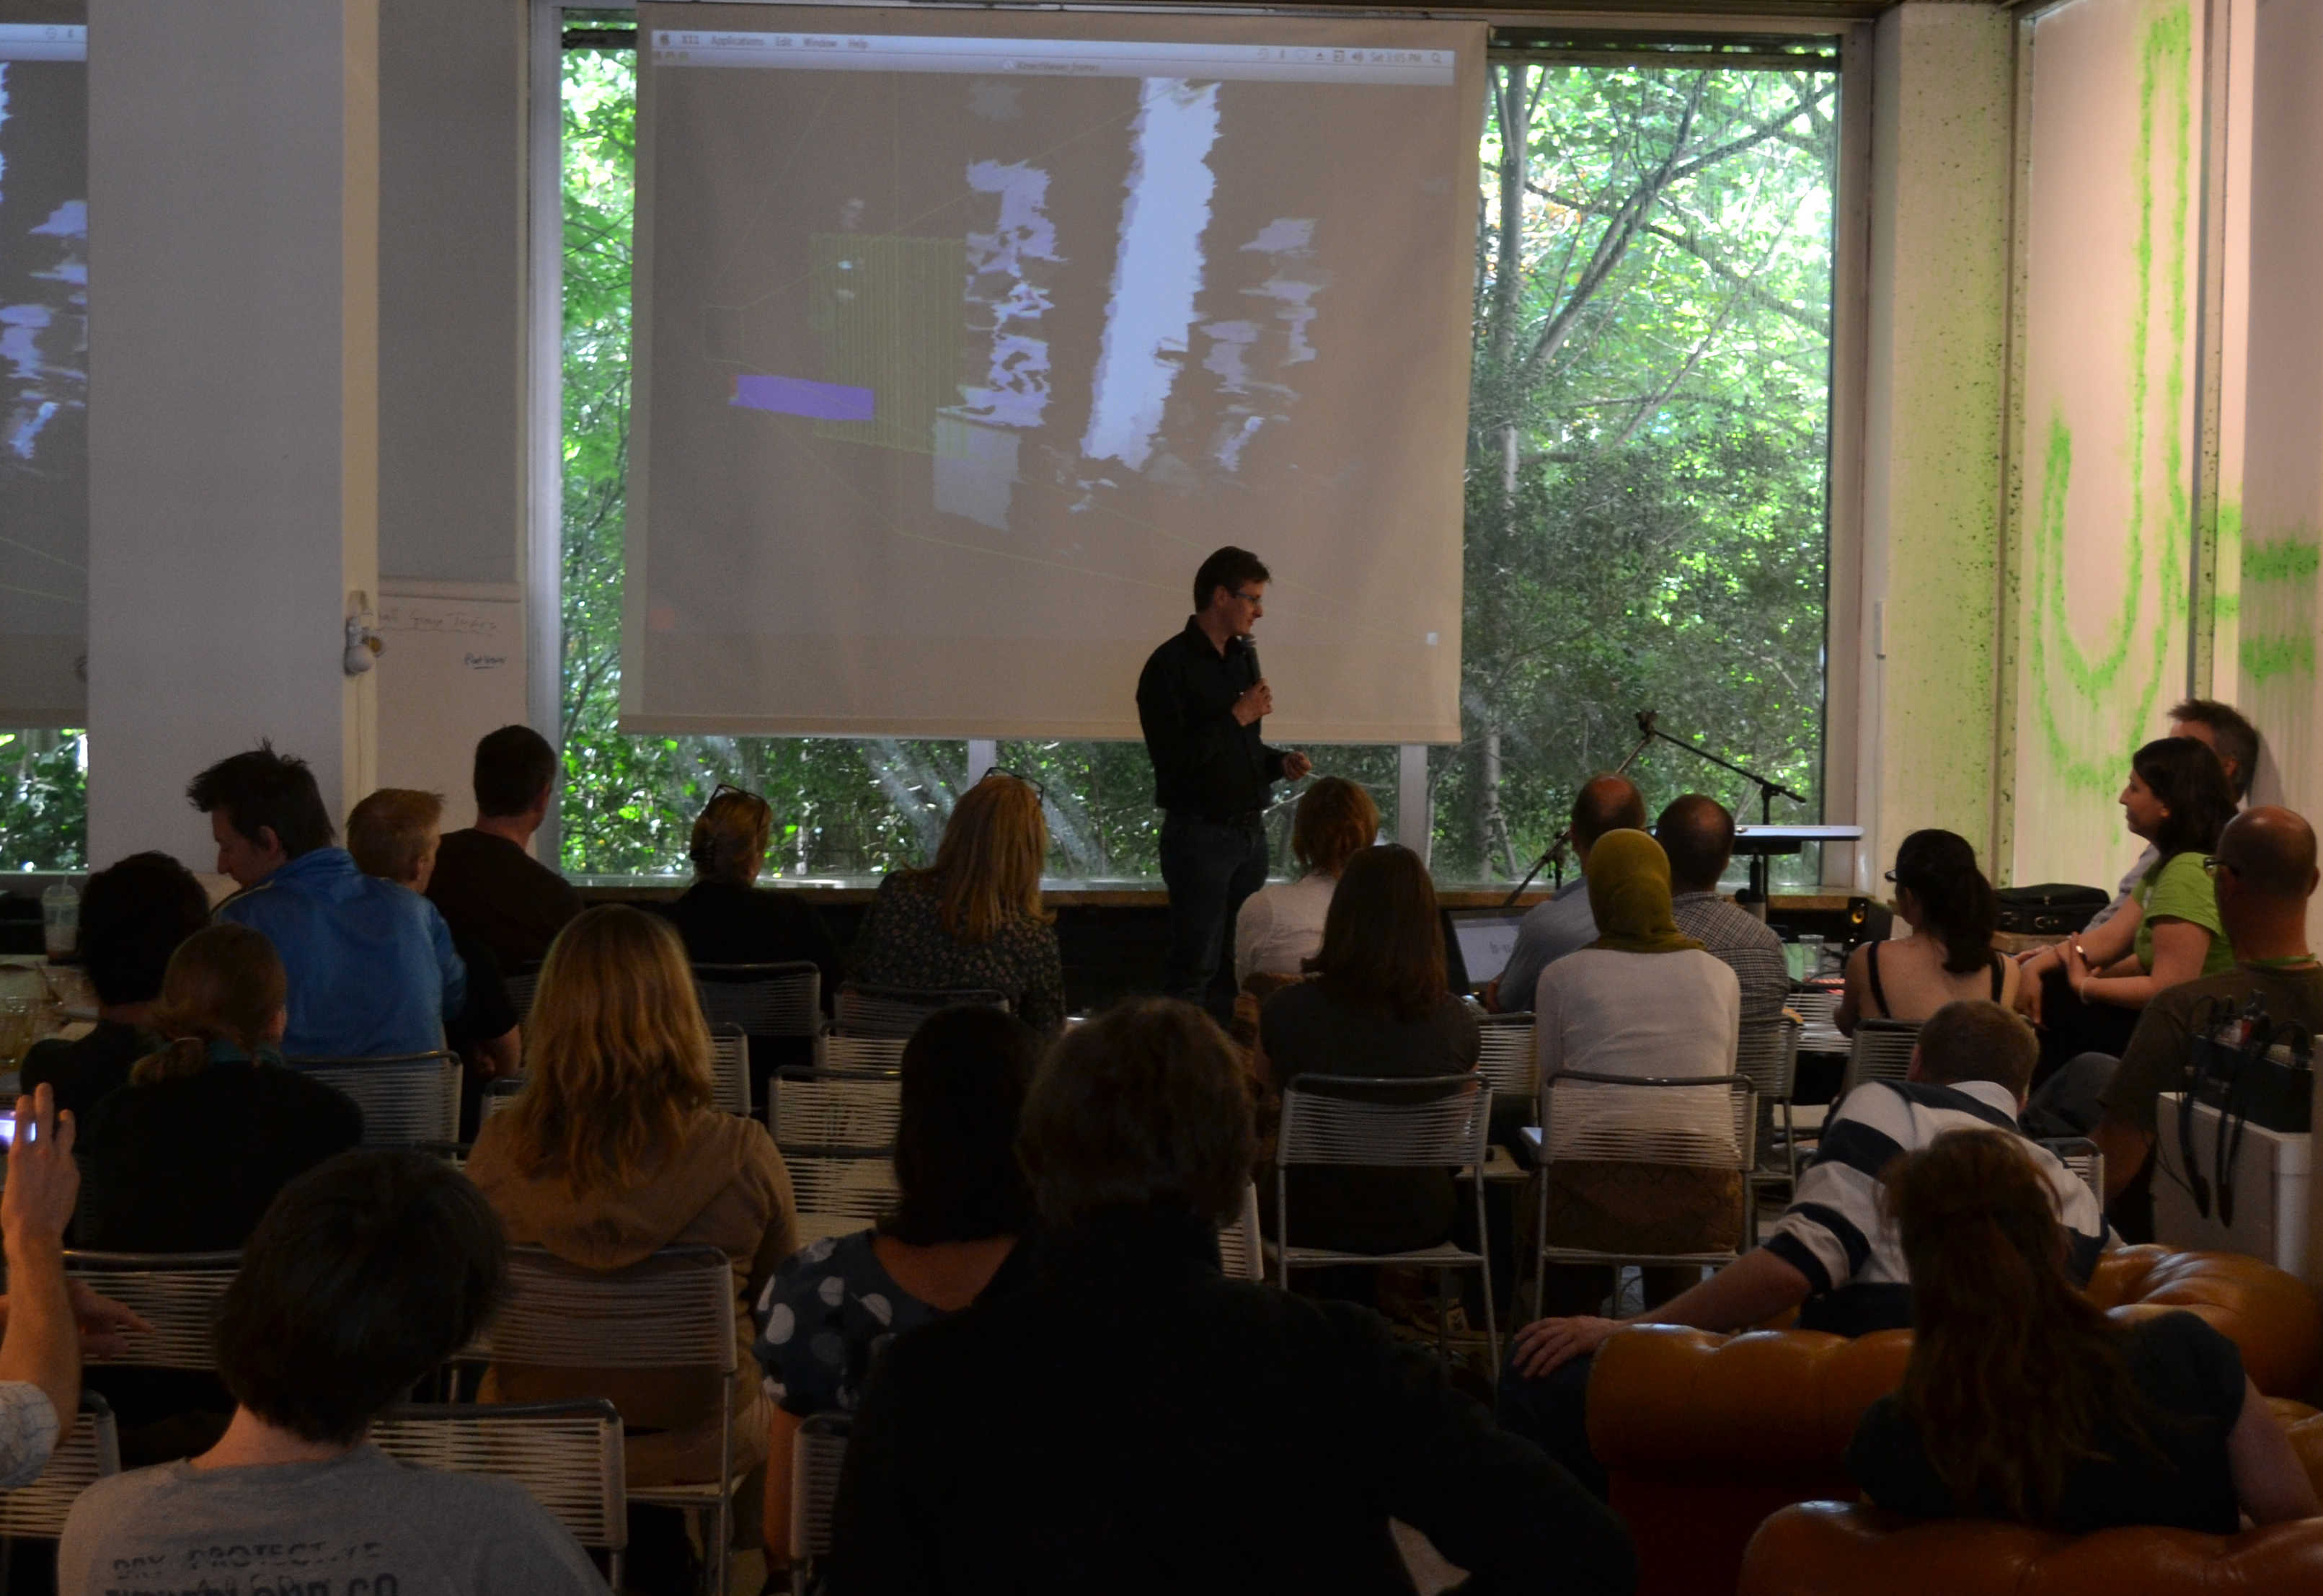
Sometimes such gaps can be filled by learning new tools and techniques, other times by making new collaborations or by completely rethinking the problem. The hope behind this event is to encourage a ‘lets share what we know’ approach through short talks, demos and discussions in the barcamp ‘unconference’ style.
Because this is a particularly interdisciplinary area we are encouraging pre-event discussion in the wiki, including short talk proposals, datasets (especially Amsterdam-centric ones) and topic suggestions. The event is expected to be mainly in English but with scope for breakout groups in any language they prefer.
Speakers
• James Bryan Graves - "Welcome to BarCamp"
• Dan Brickley - "Goals & collaboration"
• Steven Pemberton - "Why visualization?"
Other lightning talk topics:
• Government data
• Visual Design
• Working with big data
• Europeana project
• Pure Data
Example ideas
• Turning data into useful APIs
• Processing
• Augmented Reality view in Junaio, Layar or any other mobile app
Vote / ideas
Vote for existing ideas or suggest a new one here.
Information and registration
Registration is open to everybody, but ideally you have one or more of the following skills: Visual and / or interface design, data-mining, statistics, business intelligence, or front-end web development.
Please RSVP if you want to participate. Participation is free.
The Barcamp takes place in Mediamatic BANK, Vijzelstraat 68, Amsterdam from 11.00 hours till 22.00 hours.
For questions about the content of the Barcamp you can contact Zoja Bajbutovic-Brickley. For general Mediamatic related questions you can contact Deborah Meibergen.


