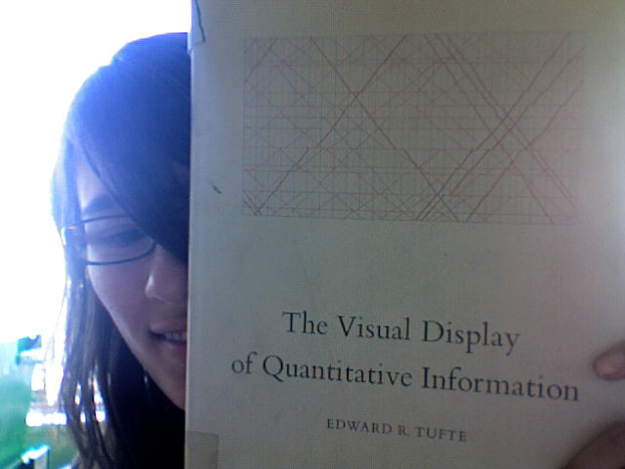
Tufte had two major agendas with The Visual Display of Quantitative Information. One was to identify many of the mistakes and abuses common to informational graphics and to finger the main culprits. The second was to go beyond common errors to develop a general theory of data graphics that could be used to explore new ways to increase their efficiency and effectiveness.
Tufte spared little wrath in critiquing the way in which many informational graphics were conceived and published. First and foremost, he deplored the widespread notion that graphics were only an unsophisticated substitute for "boring" statistics. Tufte pointed to the fact that many of those who designed graphics were trained in the fine arts and were not familiar with data analysis. This led to graphic innovations that tended to severely distort or conceal essential information within a graphic.
His all-out assault on graphic mediocrity segued into a series of principles on how make effective graphics, which he called the Theory of Data Graphics. This theory had four main aspects to it:
- Elimination of "chartjunk"
- Maximization of "data-ink"
- Multifunctioning graphical elements
- High data density
Taken together, they represented a new way of thinking about how to more successfully represent data in informational graphics.
